How to read and analyze the metrics that matter in Facebook advertising
Hello. We're ONDA, the B2B platform digitizing Korea's hospitality industry.
Last time we walked through setting up campaigns in Facebook Ads Manager. Today we're covering how to actually analyze the performance of those campaigns.
If you've ever looked at a Facebook report full of terms like impressions, clicks, CPM, CPC and thought "what am I even looking at?"—this one's for you.
Let's get started.
8 Core Metrics

Once your ad is live, you'll see metrics like link clicks, CPC, and total clicks in Ads Manager. We call the leftmost column 'dimensions' and the data columns 'performance metrics.'
Facebook offers over 200 metrics. That's overwhelming. So here are the 8 I check most often—and the ones you need to understand ad performance.
Nail these eight, and you'll have no trouble understanding the rest.
1. Impressions
How many times your ad was shown. If person A saw it twice and person B saw it three times, impressions = 5.
2. Reach
Similar to impressions, but different: the number of unique people who saw your ad. In the example above, reach = 2 (A and B).
3. Clicks (All)
There are a lot of metrics with "click" in the name. Clicks (All) counts every click on your ad—video play buttons, "Learn More" CTAs, anywhere on the creative. Not just link clicks.
4. Unique Link Clicks
Metrics with "unique" refer to the number of people who took that action. If 10 people clicked your link, unique link clicks = 10.
5. Frequency
Shown with two decimal places (e.g., 1.4). This is the average number of times one person saw your ad. If frequency is 1.4, the average user saw it at least once—probably closer to 1–2 times.
Lower is better. If frequency hits 4+, it's time to refresh your creative—people are getting fatigued.
6. CPM
"Cost per 1,000 Impressions." How much you spent for every 1,000 times your ad was shown.
7. CPC
"Cost per Click." How much you paid per link click. Calculated as total spend ÷ link clicks. Lower is better.
8. CTR
Click-through rate. The percentage of people who clicked after seeing your ad. Calculated as clicks (all) ÷ impressions.
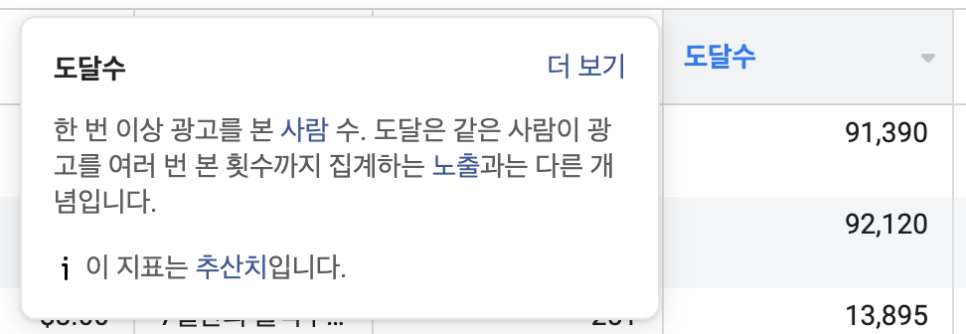
Don't stress about memorizing these. Hover over any metric in Ads Manager and Facebook will show you a tooltip with the definition. Easy.

Now that you know what they mean—what numbers should you aim for?
Honestly, there's no universal benchmark. You can't judge performance by a single number. (More on that below.)
But as a reference: in the travel industry, traffic campaigns typically see an average CTR of ~5.87% and CPM around ₩5,962. Take it with a grain of salt.
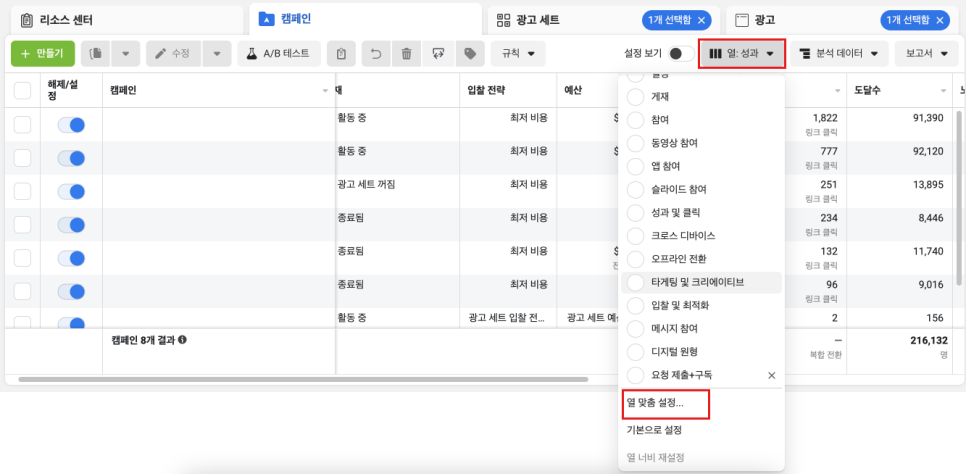
Want to see more metrics? Click "Columns: Performance" at the top right, then "Customize Columns" at the bottom.
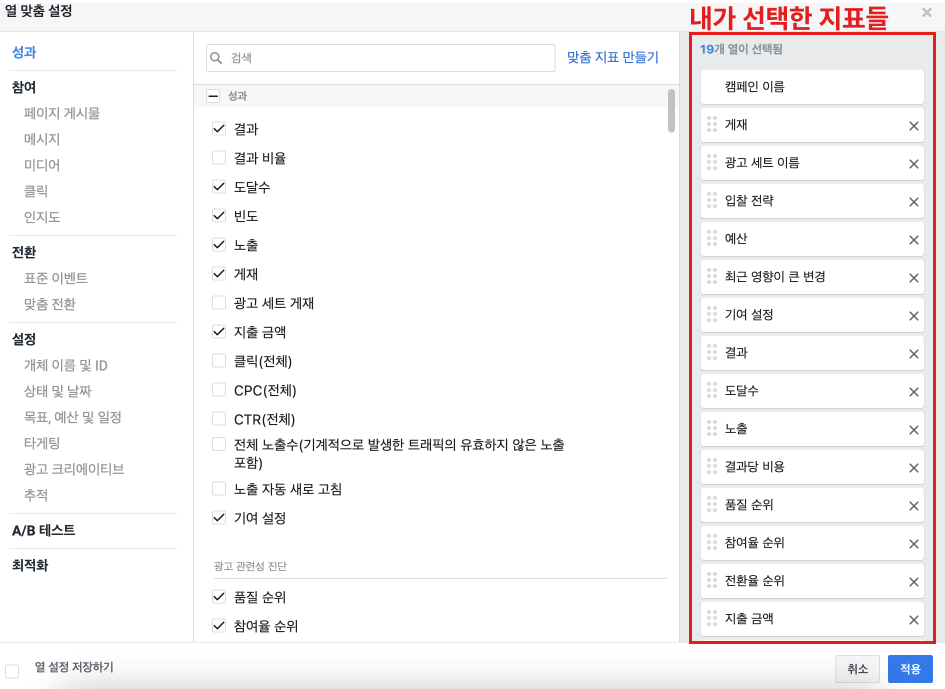
This opens a panel where you can add or remove metrics. Check or uncheck what you want to track. The number on the right ("19 columns selected") shows how many you've enabled.
How Do These Metrics Actually Help?
Understanding what the numbers mean is step one. The real skill is interpreting them and adjusting your strategy accordingly.
If impressions = 20,000, is that good?
You can't say. What matters is context. We run ads to drive bookings—not just eyeballs. If impressions are 20K but CTR is 0.2%, that's not a win.
You need to compare multiple metrics to understand performance.
Another example:
If CTR is 3%, is that good?
Depends. If last week it was 1% and this week it's 3%, yes—you're improving. You need to compare over time to judge performance.
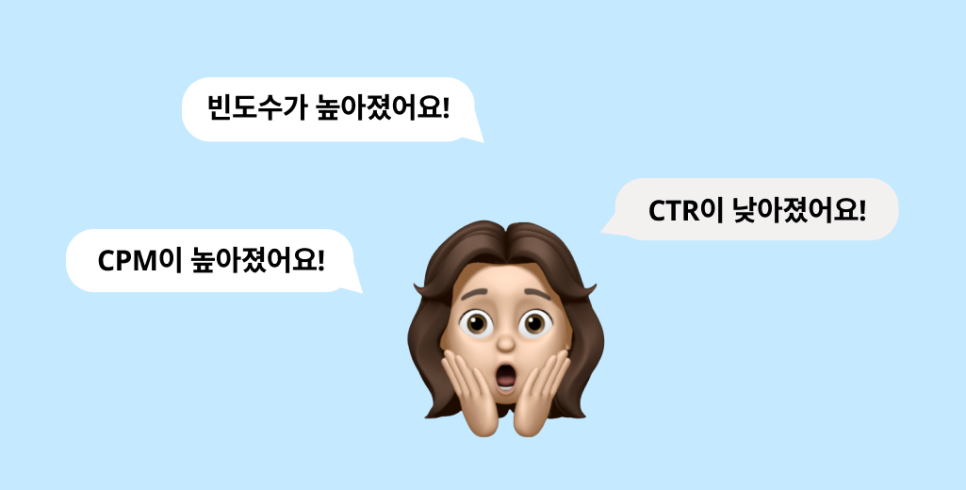
Once you interpret the metrics, how do you adjust your campaigns? Let's walk through two examples.
Example 1: CPM is rising
If CPM went up week-over-week, check your targeting. Your audience might be too narrow—competition is driving up costs. This is common during peak seasons (summer vacation, year-end holidays). If it's not a seasonal spike, broaden your audience—maybe target by age alone instead of layering on interests.
Example 2: CTR is dropping
Check frequency. If frequency is stable but CTR is down, your creative is losing appeal. Time to swap the image and copy.
If frequency is rising and CTR is falling, ad fatigue is setting in—people are seeing the same thing too many times. Refresh your creative.
These aren't hard rules that apply 100% of the time. But this is the kind of thinking you need to bring to campaign optimization.
We've covered Facebook ad setup and performance analysis. It might feel overwhelming at first—new interface, new jargon—but after a week or two of running campaigns, it'll start to click.
Hope this helps you get more out of Facebook and Instagram advertising. We'll keep sharing marketing insights that matter for hospitality operators.